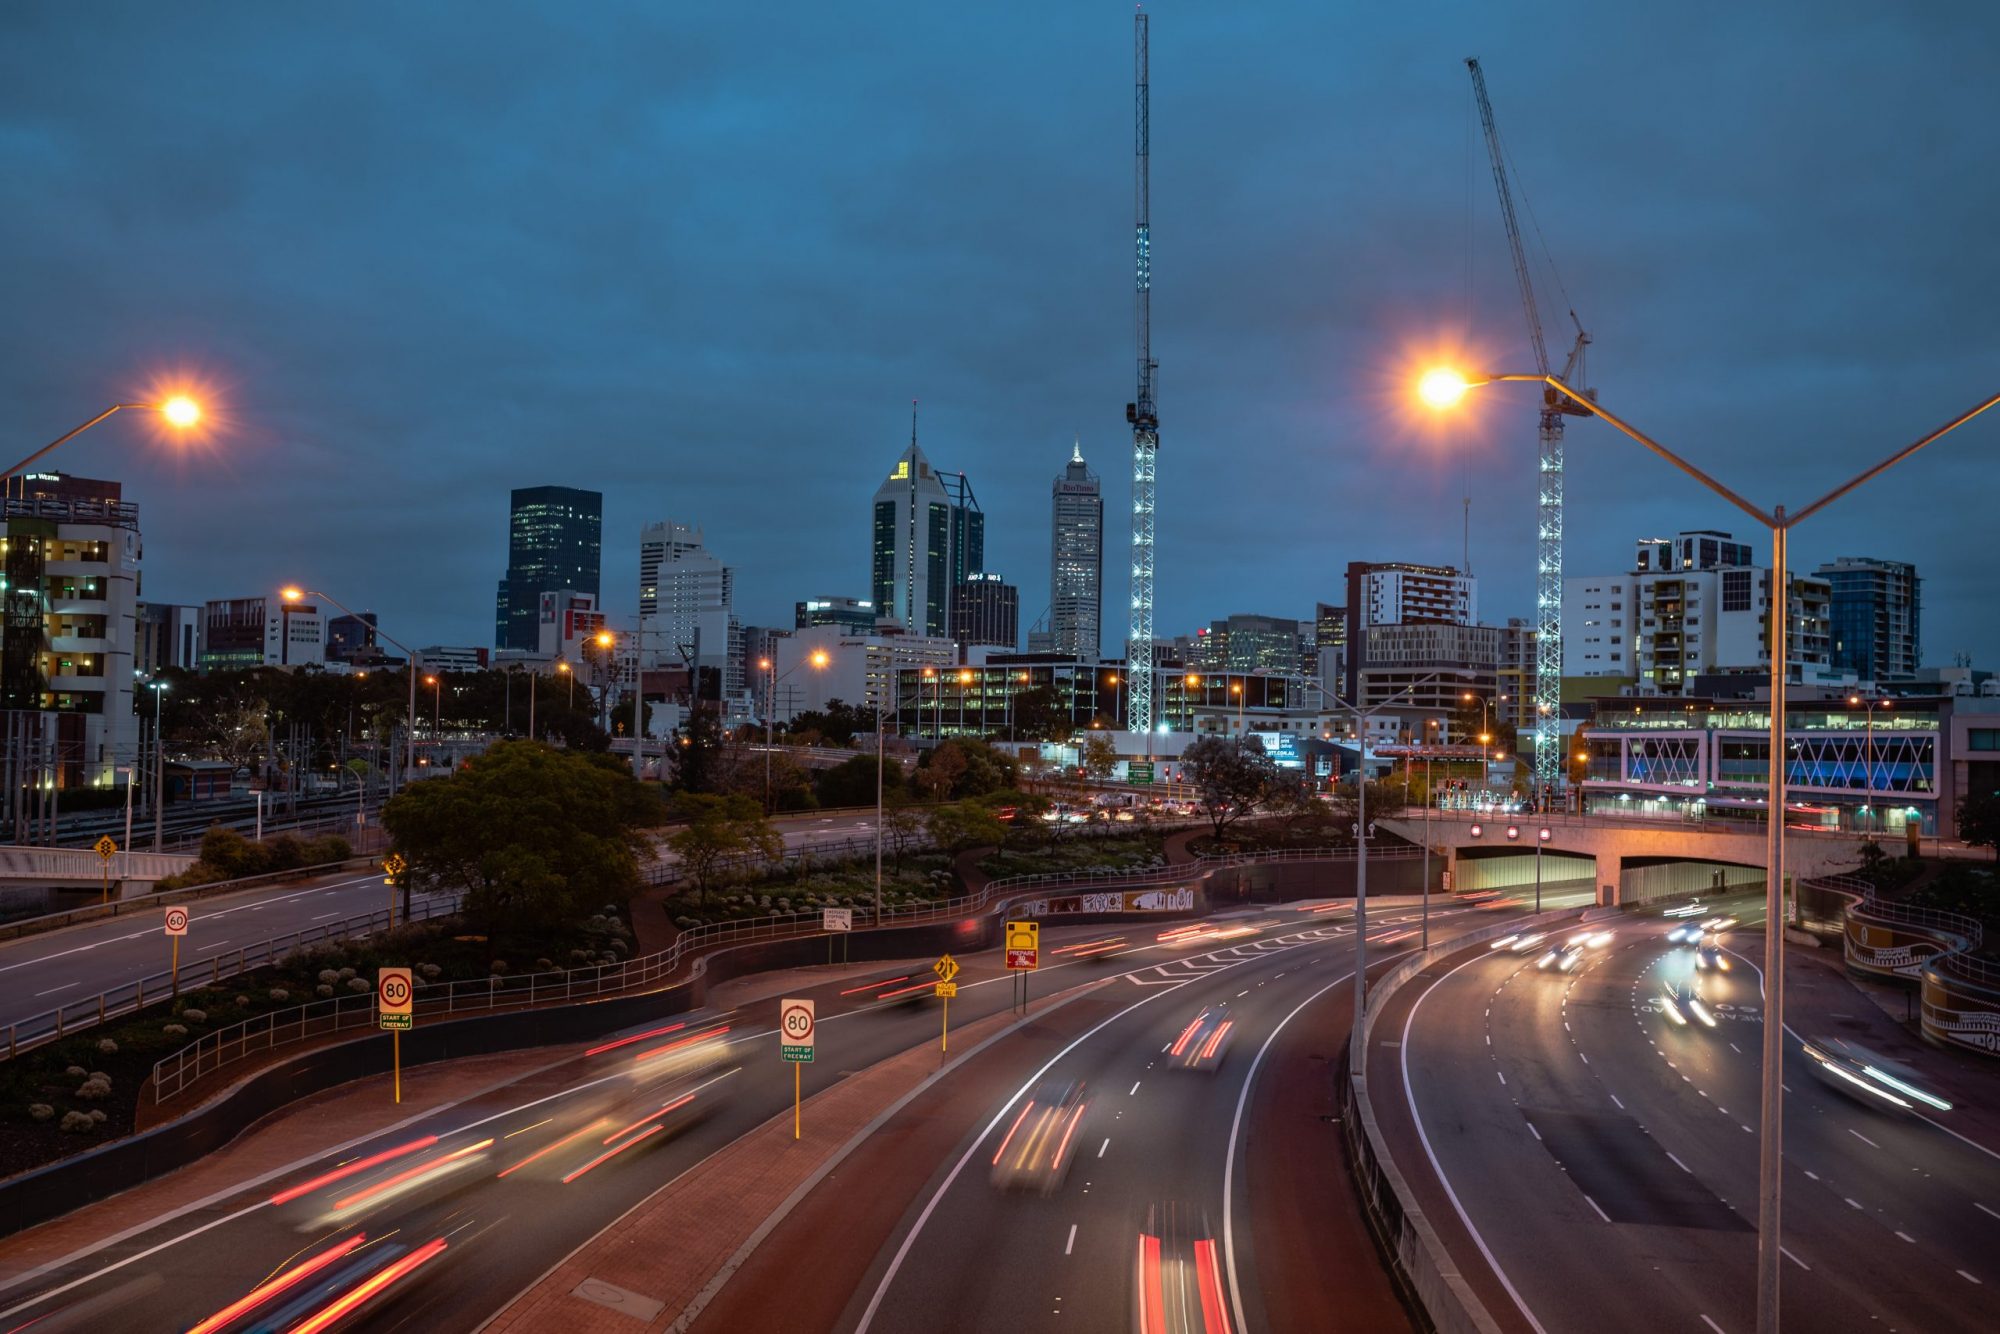
We can all agree that 2020 was a year unlike any other. At the start of the year, Australians battled devastating bushfires, floods and cyclones and had to live and work through lockdowns and other necessary restrictions to prevent the spread of the coronavirus (COVID-19) pandemic.
For many people, these events had an impact on the way they moved from point A to point B. According to data released by the Australian Bureau of Statistics (ABS), the average distance travelled by Australian passenger vehicles in 2020 was 11,100 kilometres, down from 12,600 kilometres recorded in 2018 [1].
Despite the social and economic challenges that Australians faced in 2020, road freight remained strong. ABS data released in December 2020 highlighted that road freight continued to increase to more than 223 billion tonne-kilometres, with Australia’s 4 million freight vehicles continuing to traverse the nation’s highways, even when most of us couldn’t.
At the state and territory level, New South Wales led the nation in road kilometres travelled by all vehicles, with over 69 billion kilometres of travel undertaken.
The Northern Territory, with its long distances and relatively light COVID-19 restrictions, also led the states and territories for average kilometres per vehicle at 12,500.
During the height of the pandemic, our trained and professional traffic controllers in Perth and Brisbane were integral to keeping road traffic flowing efficiently and safely through continued work on road projects, utilities infrastructure along with boarder closures, COVID testing clinics and vaccination centres.
Thanks to increasing vaccination rates, things have returned to somewhat of a new normal in most Australian states and territories in October 2021. Let’s take a closer look at some trends that have occurred this year are expected to continue into next year:
Increased use of public transport in the March 2021 quarter
According to recent research by Roy Morgan [2], 8.8 million Australians aged 14 years and older (42 per cent) used public transport during the March quarter 2021. This is up over 1 million from the December quarter 2020 and an increase of 2 million from the September quarter 2020 when only 6.88 million (32.6 per cent) were using public transport.
The low in usage of public transport was reached during Melbourne’s long second lockdown and when there were significant restrictions on people’s movement in Sydney due to the outbreak of COVID-19 centred on the Crossroads Hotel.
Despite the back-to-back quarterly increases, public transport usage in the March quarter 2021 was still down by almost 3 million people (a decline of 24.7 per cent) on its pre-COVID-19 pandemic levels when 11.8 million people used public transport in the December quarter 2019.
In the March quarter 2021 trains regained their usual spot as the most popular form of public transport used by 6.2 million (29.3 per cent) of Australians, ahead of buses used by 5.48 million (25.9 per cent).
Further use of delivery apps
In 2020, travel restrictions and lockdowns resulted in many people downloading and using delivery service apps to get everything from groceries to dinner conveniently to their doorstep, and these services will likely continue to rise in popularity in 2021, resulting in more of these cars being on the road.
According to separate research by Roy Morgan [3], more than 5.5 million Australians over the age of 14 (26.5 per cent) used meal delivery services in 2020, up from 3.9 million (19.0 per cent) in 2019 and 3.3 million (16.3 per cent) in 2018.
Rise in motor vehicle registrations
Lastly, recent ABS data indicates that there were 20.1 million registered motor vehicles in Australia in January 2021 and that the national fleet increased by 1.7 per cent from 2020 to 2021 [4].
All states and territories reported an increase in the number of registered vehicles from 2020 to 2021. Queensland, South Australia and the Australian Capital Territory all recorded annual growth of 2.3 per cent, the highest of all states and territories. Victoria’s fleet grew the least (by 0.7 per cent).
References:
[1] COVID-19, natural disasters disrupt 2019/20 vehicle use, Australian Bureau of Statistics, 2020.
[2] Public transport use increases in March Qtr. 2021 – up by 2 million from the lows of 2020, Roy Morgan, 2021.
[3] Meal delivery services Uber Eats, Menulog, Deliveroo and DoorDash experienced rapid growth during 2020 – a year of lockdowns and work from home, Roy Morgan, 2021.
[4] Motor Vehicle Census, Australia, Australian Bureau of Statistics, 2021.


